
The UKCEH Countryside Survey soil benchmark tool allows exploration of our soil model outputs (maps), and provides visual ways to benchmark both spatial predictions and user data within the national context.
The tool uses models created from our long-standing national soil monitoring programme, the UKCEH Countryside Survey (CS). The CS assesses all major soils types across Great Britain alongside vegetation, water quality and many other aspects of the countryside.
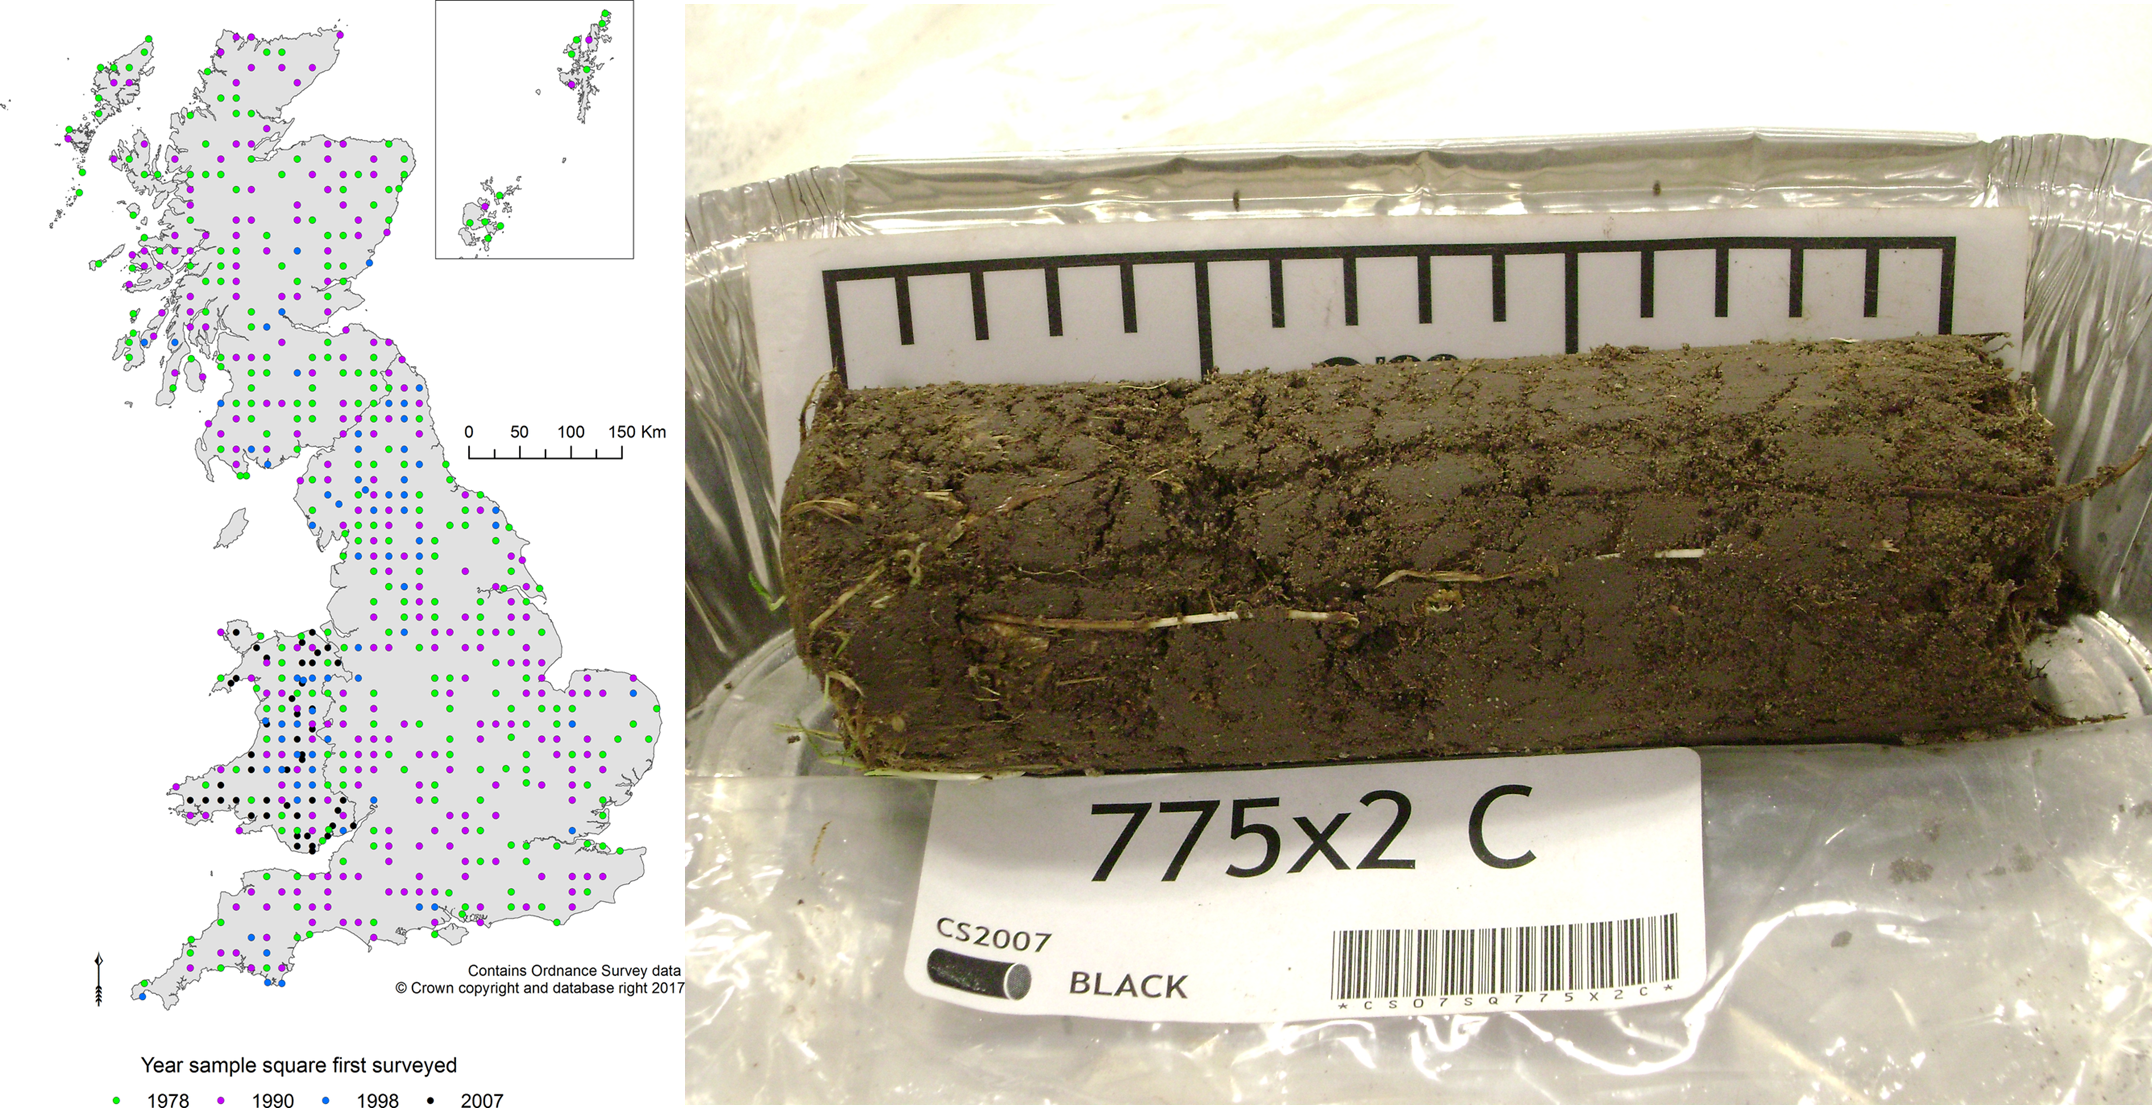
Approximately 3000 topsoils (0-15cm) have been analysed for a large number of indicators which tell us about current soil health and how it is changing. We have data from 1978, 1998, 2007 and now sample every year on a 5 year rolling programme. The data used in this app is the modelled output of statistical upscaling of the 2007 survey data to every 1km square across GB, using numerous environmental predictors (climate, land use, geology). To read more on these models and access the mapped outputs directly click here.
Usage:
a) Data exploration ("1. Map viewer"). Use the maps to explore the spatial distribution of 4 soil indicators:
- Carbon and nitrogen concentration (how much C & N the soil is storing which is important for moisture, nutrients and also for climate)
- Soil pH, a measure of the acidity status of the soil, which is also highly related to a number of other soil functional properties, affecting things like plant growth and soil microbes
- Soil invertebrate numbers (soil biology is a key component of soil health)
b) Benchmark data for a specific location ("2. Query location"):
- Use the map pointer or enter lat/long for the location you are interested in
- After pressing "Show soil properties", the output will display the most probable land use and soil measurements for this location ("3. All predictions")
- Compare the predicted measurements for this location against other predictions by selecting a soil property of interest (from "4. Plot prediction"). The plots produced show the predicted values for the selected location (black bar on plot) against all land uses across GB, and against the specific land use relevant to the selected location. A final plot gives the error for the predictions.
- Enter your own data on soil organic matter (%) from your selected location, and see how it compares to the benchmarks described above, using the "Benchmark your soil" box.
Contact: Rob Griffiths
3. All predictions for this location
4. Plot prediction in context
Loading...
Benchmark your soil
Enter organic matter data for this location as percent loss on ignition. After conversion to carbon concentration, this value will then be shown in the plots above as a red line.
Benchmark your soil
Enter soil pH data for this location. This value will then be shown on the above graphs as a red line.
Click the button below to run on-the-fly predictions of land use and soil properties for the selected location, based on machine learning models. This function is currently being developed to allow user interactivity, both for exploring different land use scenarios and explaining model outputs. Note the predictions may differ to the previous map outputs, due to differences in the modelling approach used.
Output:
Loading...